




What is construction workforce planning?
Construction workforce planning is the process of matching the crews, trades, and labor hours a contractor needs against the workforce it can actually field, across every project and week. A working plan converts backlog into labor-hour demand by trade, compares it to available direct, subcontract, and agency labor, and is corrected every week against verified site attendance.
- The three planning horizons, from annual capacity to the two-week lookahead
- Why construction workforce plans miss, and the assumption that causes most of it
- A six-step planning process that turns backlog into crew requirements by trade
- The weekly plan-versus-actual review that keeps the plan honest
Every construction workforce planning guide makes the same promise: the right people, on the right site, at the right time. Most of them stop at the forecast. They show how to turn a schedule into a headcount curve and leave out the part that decides whether the curve means anything, which is checking it every week against who actually showed up.
This guide is for operations leaders, superintendents, and project managers at US general contractors and specialty contractors running several jobs at once. It covers the three planning horizons, a six-step process from backlog to crew assignments, the metrics that keep the plan calibrated, and how subcontractor and agency labor fit in.
What is construction workforce planning?
It is the discipline of forecasting how much labor each trade will need, week by week and site by site, and deciding how to supply it: from direct employees, subcontractors, staffing agencies, overtime, or by moving work. It differs from general workforce planning in one important way. Demand is set by project schedules that shift weekly, and a large share of the supply is not on your payroll.
The pressure is real. Associated Builders and Contractors estimates the US industry needs to attract roughly 349,000 net new workers in 2026 just to keep labor supply and demand in balance. When every trade is short, a plan that overstates available crews by 10 percent does not just slip one job. It slips the jobs those crews were promised to next.
Planning happens at three horizons, and most contractors are strong at one and weak at the other two.
| Horizon | Question it answers | Typical owner | Data it runs on |
|---|---|---|---|
| Strategic (12 to 36 months) | Do we have the trades and supervisors to win and staff the backlog we are chasing? | Executives, operations, HR | Pipeline, win rates, retirements, historical labor-hours per dollar |
| Project (life of the job) | How many workers of each trade does this project need, week by week? | Project manager, superintendent | Estimate, schedule, labor-hours per unit from past jobs |
| Operational (2 to 6 week lookahead) | Which crews go to which site next week, and where are the gaps? | Superintendents, foremen, resource manager | Lookahead schedule, verified attendance, subcontractor commitments |
The strategic horizon decides who to hire and train. The project horizon decides how the estimate turns into crews. The operational horizon, the two- to six-week lookahead, is where plans succeed or fail, because it is the only horizon that meets the field every day. The general guide to workforce planning covers the strategic layer across industries; this guide concentrates on the project and operational horizons, where construction is different.
Why construction workforce plans miss
Construction workforce plans miss for the reasons everyone expects, like weather, late materials, and design changes. They also miss for a reason that rarely appears in the plan itself: the plan assumes a crew size, an attendance rate, and a productivity rate, and nobody checks those assumptions against the field until the schedule has already slipped.
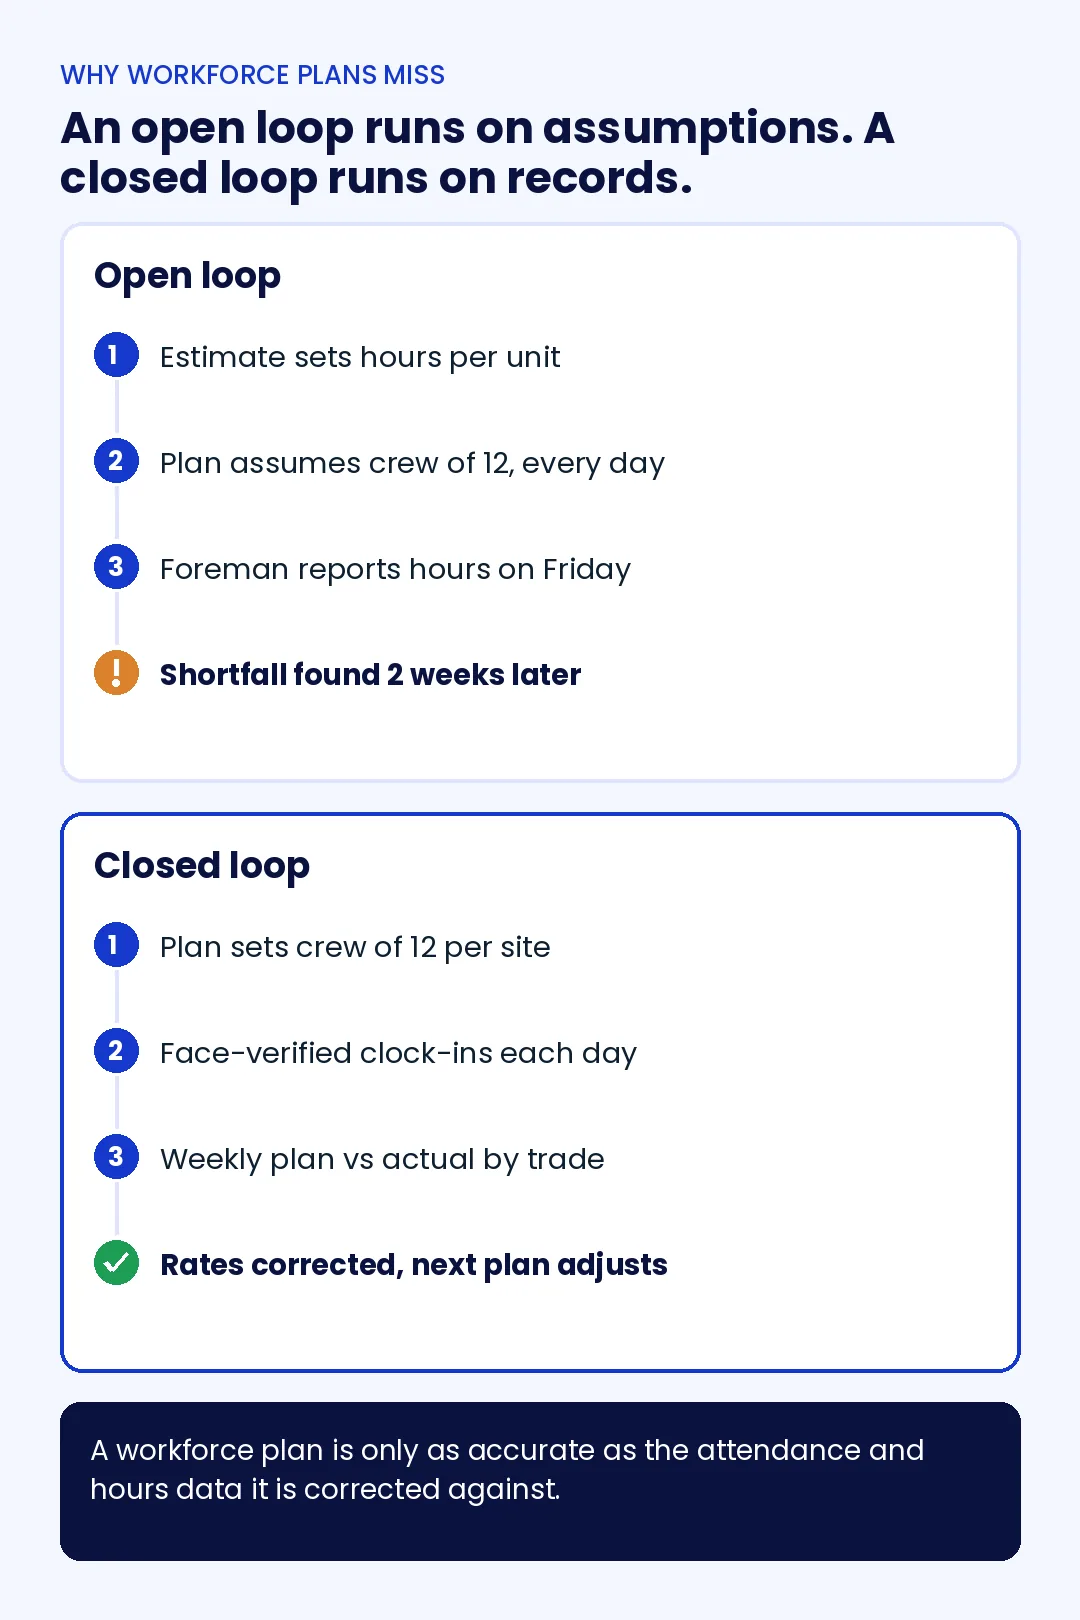
Consider how most plans are built. The estimate gives labor-hours per unit. The scheduler spreads those hours across the weeks. The resource manager asks the foreman or the subcontractor for a crew of 12. The plan now assumes 12 workers, present every scheduled day, producing at the estimated rate. The only feedback is a timesheet at the end of the week, prepared by the same foreman, often reconstructed from memory.
That loop is open. If the drywall sub sends 9 workers instead of 12 on three days out of five, the plan still shows 12, the timesheet often shows hours that look close enough, and the shortfall surfaces two weeks later as a missed milestone. Bridgit's 2025 survey of construction leaders found that 71 percent of companies still plan on spreadsheets or whiteboards, which means most plans are not connected to any live record of who is on site.
A workforce plan is only as accurate as the attendance and hours data it is corrected against. Better forecasting software does not fix an assumption nobody measures.
A six-step construction workforce planning process
The process below works for a contractor with three active jobs or thirty. Steps one through five build the plan; step six is what keeps it true.
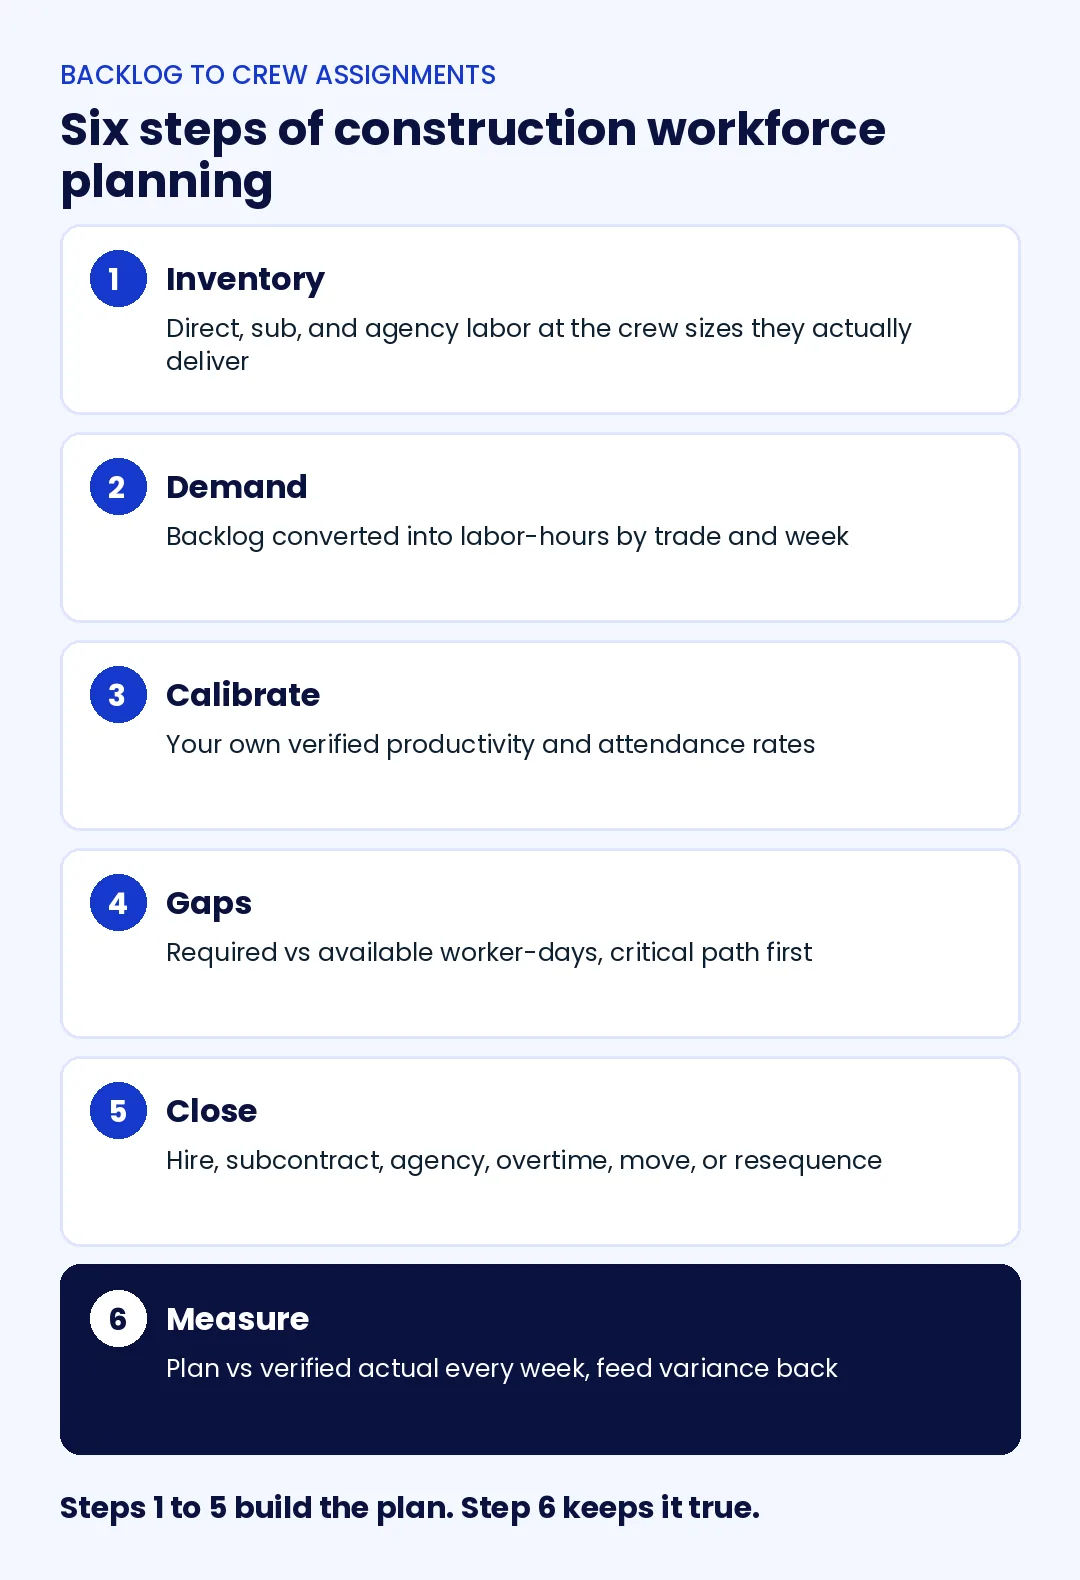
- Inventory the workforce you can actually field. List direct employees by trade, certification, and home site, then add each subcontractor and staffing agency with the crew sizes they have reliably delivered, not the sizes they quote. A sub that commits 15 and averages 11 belongs in the plan at 11.
- Convert backlog into labor-hour demand by trade and week. Take each project's quantities, apply labor-hours per unit, and spread the result across the schedule. Add awarded work and a probability-weighted share of the pipeline for the strategic view.
- Apply your own productivity and availability factors. Replace estimating-book rates with your verified history: hours per unit from past jobs, attendance rate by trade, and the share of scheduled days lost to weather or access. This is the step most plans skip, and the reason most plans are optimistic.
- Compare demand to supply and find the gaps. Lay required worker-days against available worker-days by trade and week. The gaps that matter are the ones on the critical path in the next six weeks.
- Decide how to close each gap. The options are hire, subcontract, bring in agency labor, schedule overtime, move a crew from another site, or resequence work. Each has a cost and a lead time; overtime is fastest and most expensive, hiring is slowest.
- Measure plan against actual every week and recalibrate. Compare planned headcount and hours to verified headcount and hours by site and trade, then feed the variance back into steps one and three. A plan that is never compared to actuals stops being a plan within a month.
A mechanical contractor running six jobs across two metro areas used exactly this loop after a quarter of missed lookaheads. The forecasting was sound. The problem was step one: two subs were planned at their quoted crew sizes and delivered about 75 percent of them. Planning those subs at their verified rate, and booking a third sub for the difference, ended the slippage without changing the schedule.
The numbers that make a workforce plan real
Five metrics, calculated from verified attendance and hours rather than self-reported timesheets, do most of the calibration work. Each one changes a specific input in the plan.
| Metric | How to calculate it | What it changes in the plan |
|---|---|---|
| Attendance rate by trade | Verified worker-days present divided by worker-days scheduled | The buffer you add to every crew request for that trade |
| Planned vs verified headcount | Headcount in the lookahead minus face-verified clock-ins, per site per day | Which sites are understaffed before the schedule slips |
| Labor-hours per unit | Verified hours on a cost code divided by quantity installed | The productivity rate used to convert next project's quantities into hours |
| Overtime share | Overtime hours divided by total hours, by site and trade | Whether the plan is short a crew and paying for it in premium time |
| Subcontractor fill rate | Verified sub headcount divided by committed sub headcount | How much of the next gap you can safely hand to the same sub |
The productivity metric is where verified data pays off most. Labor-hours per unit is the number that converts the next job's quantities into crew requirements, and it is computed from hours that were actually worked on a cost code. If those hours are rounded, reconstructed on Friday, or include a worker who left at noon, the next plan inherits the error. The construction cost tracking guide covers how labor-hours flow from the punch into the job cost report the plan is built on.
Planning subcontractor and agency labor
On most US commercial jobs, a large share of the workforce belongs to someone else. Electrical, mechanical, drywall, and concrete are often subcontracted, and peak periods are filled with agency labor. A workforce plan that treats those crews as fixed numbers in a spreadsheet is planning with the least reliable input it has.
Three practices make subcontract and agency labor plannable. Plan each sub at its verified fill rate rather than its committed headcount. Track each agency's workers as a separate group with its own headcount cap, so the plan can see which supplier is short. And write daily attendance into the subcontract, so the sub's own foreman sees the same record you plan from. The guide to subcontractor time tracking covers how general contractors build that record and reconcile invoices against it; for the scheduling side of several trades on one site, see how to coordinate multiple contractors on large projects.
A general contractor staffing a 14-month hospital project with four subs and two agencies found that its biggest planning error was not the forecast. It was the assumption that agency workers would arrive at the committed count every Monday. Measuring agency fill rate by week showed Mondays after a payday averaged 18 percent short, which turned into a standing Monday buffer in the plan.
The weekly plan-versus-actual review
The review that keeps a construction workforce plan accurate takes about an hour a week once the data arrives without manual collection. It follows the same order every time, because headcount gaps explain most hours and productivity gaps.
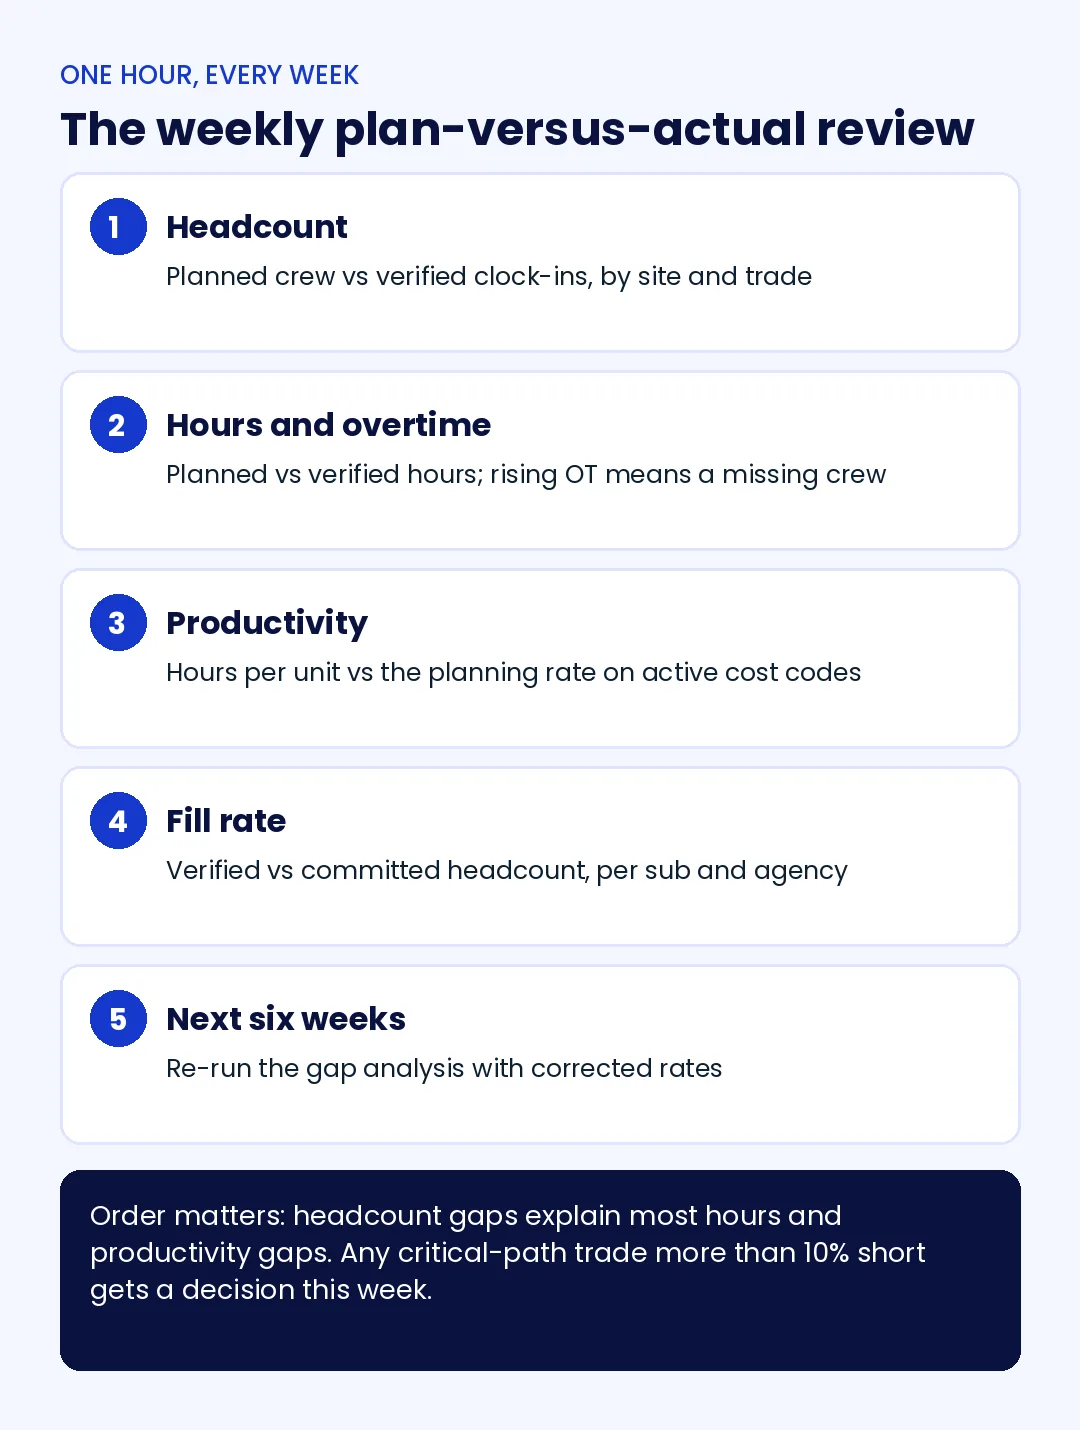
- Headcount by site and trade. Planned crew size against verified clock-ins for each day of the past week. Any site more than 10 percent short on a critical-path trade gets a decision this week, not next.
- Hours and overtime. Planned hours against verified hours, with overtime called out. Rising overtime on one trade usually means the plan is a crew short and paying premium time to hide it.
- Productivity on active cost codes. Hours per unit installed against the planning rate. A sustained miss changes the rate for the rest of the job and for the next estimate.
- Subcontractor and agency fill rate. Verified headcount against committed headcount, per supplier. The supplier with the lowest fill rate is the first conversation of the week.
- Next six weeks. Re-run the gap analysis with the corrected rates and confirm crew assignments for the next two weeks.
Companies outside construction that staff work across sites, facility management firms with cleaning crews in 40 client buildings for instance, run the same review with sites in place of projects. The structure holds because the underlying question is the same: did the people the plan counted on actually arrive?
Spreadsheets, planning software, and the attendance layer
Workforce planning in construction usually runs on three layers, and they are not substitutes for each other. Spreadsheets or a dedicated planning platform hold the forecast, the assignments, and the gap analysis. Project management and scheduling software holds the schedule the demand comes from, covered in the construction planning and scheduling guide. The attendance layer records who actually worked, where, and for how long.
Most contractors invest in the first two and leave the third to paper timesheets and foreman reports. That is the layer that decides whether the other two are working from facts. A planning platform fed with self-reported hours produces a precise forecast of an imprecise past.
How Truein supports workforce planning on construction sites
Truein is a face recognition and GPS-based time and attendance platform for contract and multi-site workforces, used by 500+ customers across 10,000+ locations. It is not a forecasting or scheduling tool. It is the attendance layer that gives a workforce plan verified actuals to be measured and corrected against.
Workers clock in by face on their own phone or a shared tablet at the gate, inside a geofence drawn to the site, with no dedicated hardware. Every punch is tied to a verified worker, a site, and a time, so the headcount and hours in the weekly review are records rather than recollections. Clock-ins at sites with no signal are captured on the device and sync later, flagged as captured offline. Subcontractors and staffing agencies are set up as separate agencies under one account, each with its own headcount cap and a supervisor view limited to its own crew, which makes fill rate by supplier a report rather than a spreadsheet exercise.
Verified hours export payroll-ready by site, trade, and contractor into ADP, QuickBooks, Sage, Viewpoint, and other systems, and the same data can be exported for the planning tool you already use. The construction time tracking software page covers site setup, and the contract workers attendance page covers the agency controls. One limit worth stating plainly: Truein measures the workforce you deployed; the forecast, the schedule, and the hiring decisions stay in your planning process.
Conclusion
Workforce planning in construction is usually treated as a forecasting problem, and the forecasting part is the easier half. The harder half is knowing whether the crews, attendance rates, and productivity rates the plan assumes are the ones the field delivers. Build the plan in six steps, then measure it every week against verified headcount and hours, by site, trade, and supplier.
Contractors that close that loop find that their construction workforce planning stops being a quarterly spreadsheet and becomes a weekly decision about where the next crew goes, made from records rather than recollection.
Frequently asked questions
What are the 5 R's of workforce planning?
The 5 R's are commonly listed as the right people, with the right skills, in the right place, at the right time, at the right cost. In construction the hardest of the five is the right place at the right time, because site assignments change weekly and a share of the workforce belongs to subcontractors and agencies. Measuring verified headcount by site is what tells you whether that R is being met.
How do you forecast labor needs for a construction project?
Take the project's quantities by cost code, multiply by labor-hours per unit from your own completed jobs, and spread the resulting hours across the schedule by trade and week. Divide by hours per worker-day and by your verified attendance rate for that trade to get crew size. Recalculate whenever the schedule or the measured productivity rate changes.
What is the difference between workforce planning and resource scheduling in construction?
Workforce planning decides how much labor each trade needs and how to supply it over months, including hiring, subcontracting, and agency labor. Resource scheduling assigns specific crews and workers to specific sites and days within that plan. Planning sets the numbers; scheduling fills them with names, usually inside a two- to six-week lookahead.
What software is used for construction workforce planning?
Contractors use spreadsheets or dedicated workforce planning platforms for forecasting and assignments, scheduling and project management software for the demand side, and a time and attendance system for actual headcount and hours. The planning tools hold the forecast; the attendance layer supplies the verified data the forecast is corrected against each week.
How do subcontractors fit into a construction workforce plan?
Plan each subcontractor at the crew size it has reliably delivered, not the size it commits, and track its fill rate weekly against verified attendance. Treat each sub and staffing agency as a separate supplier in the plan so a shortfall can be traced to its source and covered before it reaches the critical path.
How often should a construction workforce plan be updated?
Review the operational plan weekly against verified headcount and hours, refresh project-level crew curves whenever the schedule changes materially, and revisit the strategic plan quarterly against backlog and pipeline. A weekly cadence matters most, because it is the only one fast enough to catch a short crew before it delays a dependent trade.
